Our housing shortage: Our politicians have got it wrong
Read the blog to find out why.
In the beginning, the Old Testament tells us, God begat Adam and Eve. They in turn begat Cain and Abel. And ever since then, a lot of begetting has been going on. It still is, albeit that we have not recently been going out and multiplying quite as fast as previously anticipated.
Hence, we have a growing population, who all have an expectation of being housed decently and affordably. For too many that is currently just a pipedream. So, at a national level, we need to keep building new homes, and deliver the variety of sizes and tenures that meet that need.
The tricky bit comes in deciding how many homes of the different types we need to build, and where to build them sustainably. That’s a policy call for politicians. And, whilst politicians of all persuasions love to stick their hands in the pig slurry that’s called planning, and all have dirty hands, I am afraid that none of them has proved to be very good at it.
Artificial numbers – not a solution to a shortage
Let’s start in this note by looking at housing numbers. The current Government, of 12 years standing, tells us that for all their never-ending tinkering with the planning system we still aren’t building enough homes, and hence there is a housing crisis. They have a manifesto promise to solve the problem by building 300,000 new homes each year. The other main parties also have committed themselves to building even higher numbers of houses.
Sadly though, none of these promises is supported by any good hard evidence that they measure promise to need. We need to recognise these manifesto pledges for what they are, namely well-meaning but artificial politicians’ numbers, not the solution to a shortage.
Nor is there any evidence that any of these manifesto pledges is deliverable in reality. For all the political tinkering, at no time since the start of the millennium have more than 244,000 homes been built in any one year. Any increase in that number would require a major, and highly controversial, relaxation of the checks and balances that dictate where new development is acceptable, coupled with a Government commitment to a significant new social housing programme. There is no sign of that. The pledges are hollow.
Not only that. Headline overall house building numbers mask the real need, which is to prioritise particular types of housing, and to concentrate house building where that need is greatest. There are, for example, no target building numbers for building affordable and social housing – especially rural affordable homes – where the shortage and need are the most urgent but the level of delivery is lowest; nor to cater for the different housing needs of an increasingly older population.
Where, too, is the evidence of prioritising new housing growth in run-down areas where regeneration is most urgent, but where maintaining developers’ profit margins may be challenging? Where we have the greatest need for political direction, we have instead a void, allowing developers to continue their highly profitable practice of focussing on large market housing on greenfield sites, especially in the South East.
Instead, we have a centrally driven system designed to divvy up the artificial 300,000 homes p.a. between the country’s 330 or so planning authorities based on an algorithm – (don’t we all love algorithms!) The algorithm applies a standard methodology which purports to tell each authority what its local housing need is, and what its home building target should be to enable that national target to be met.
To do its job of pretending to deliver an arbitrary, unachievable housing target, the algorithm has to take liberties with both logic and evidence. The inevitable result is to exaggerate strikingly the deemed level of housing need throughout Sussex’s planning districts (and elsewhere in the South East).
The magic tricks of an algorithm
Let me unveil two of the magic tricks that the algorithm uses to achieve its purpose.
The first involves its use of untrue data. The algorithm requires one to use long term projections of future household levels in each planning district published by the Office for National Statistics (ONS) in 2014. All very well, you might think. But the ONS has subsequently published more up- to- date projections in 2016 and 2018, and population projections (but not yet household projections) for 2020.
All this more recent data tells us that people have not been busy begetting anything like as fast as it was thought that they would back in 2014, and that austerity is not generous to life expectancy. The rate of population and household growth has slowed down markedly. It is continuing to do so. Just using the 2018 rather than the 2014 data would roughly halve the number of new houses needed. That is inconvenient for politicians with a fixed notion as to the level of our housing shortage. So, planning authorities are required to ignore this more up to date information in assessing their housing need. And hey presto, a whoppingly exaggerated result is pulled out of the magician’s hat.
The algorithm’s second trick is even trickier. Its aim is to redress the imbalance in average house prices in different parts of the country. It does so via a so-called “affordability factor” which is designed to penalise authorities in areas where average house prices are highest, notably in the South East. The affordability factor requires those authorities to multiply what would otherwise be their assessed housing need by a factor linked to, amongst other things, the extent to which average house prices exceed the national norm.
The theory of course is that the increased supply of houses will push down prices. In the case of Lewes district, for example, that requires building an additional 70% more dwellings than the actual (but, as we have seen, already exaggerated) need. In Mid Sussex it is 40%.
Brighton is singled out for special treatment – as one of England’s largest conurbations, it is required to add yet another 35% on top of all the other add-ons, and never mind the fact that Brighton, snuggling below the South Downs National Park, cannot simply expand and doesn’t even have enough sustainably developable land to meet more than half of its current housing need.
Laudable as the theory may be, it doesn’t work that way in the real world. There isn’t a shred of evidence that developers drop their prices when they build more homes – Government has been told that by its own advisers. They simply buy up more greenfield land, build more large market houses, pocket the large extra profits and offer more generous political donations.
You simply cannot build your way to cheaper housing in the South East. And the policy that demands it operates in a way which fuels development in the most overheated corner of the country and disincentivises development in areas most in need of regeneration and good quality new housing.
The affordability factor adjustment is a second nonsensical feature of the mutant algorithm that further exaggerates our South East housing needs.
A 53% fall in housing need
CPRE Sussex calculates that, if the algorithm applied the latest 2018 household projections instead of 2014 data, and if the irrational and ineffective affordability factor were done away with, it would reduce Sussex’s annual housing need by a breath-taking 53%: from 12,423 dwellings to 5,746. The table at the end of this note breaks those numbers down, district by district.
The following example provides another way to look at it is this. Mid Sussex DC is reviewing its current District Plan and plans to extend it until 2038. The council has (so far) taken the position that to meet its unmet housing need over that period it must allocate 27 new (all greenfield) sites in the district on top of the 29 sites already earmarked. These would include four new super-sites for 7,300 homes.
We estimate that if Mid Sussex’s algorithm-adjusted housing need were calculated as we suggest above, its need over the period to 2038 would be 10,100 fewer than the standard method requires, obviating the need for many of the proposed new site allocations, including all four super-sites.
It is no part of my purpose to convince you that CPRE Sussex’s numbers are an accurate calculation of Sussex’s housing needs. Our numbers are simply extrapolations from the Government’s own deeply flawed algorithm designed to deliver an arbitrary, undeliverable, but manifesto-committed 300,000 houses p.a. But we do say that it’s nearer the truth than the nonsensical and vandalising numbers demanded by the current planning system, which require the concreting over of so much of our countryside. It really should not be that way.
It is no wonder that a Surrey planning authority (Spelthorpe BC) has admitted that its own draft plan will result in its borough becoming “a less attractive place to live”, calling the process by which its housing target got calculated as “brutal” and describing it as “divisive, bruising and at times unpleasant; one that has fractured communities and turned councillors against each other”.
Chipping away at protection of environmentally special places
Nor does the inequity of it all end there. Calculating an authority’s housing need is the starting point, not the end point of determining what its local plan housing target should be. The rules mandate that the target should be reduced where there are significant environmental or infrastructure constraints to development in an area.
Sussex has many environmental constraints: a National Park, two Areas of Outstanding Natural Beauty and numerous Sites of Special Scientific Interest and ancient woodlands for a start. All of which are designated by law in order to conserve their special landscapes and to encourage their biodiversity – they also have a special climate change mitigation role that goes unacknowledged by the planning framework.
In some Sussex districts they make up over half of the land area (in Rother it is 82%). New development in these areas is supposed to be limited in scale and extent, and major development there avoided altogether.
But when it comes to fixing district housing target the Planning Inspectorate typically ignores such inconveniences in settling a district’s housing target, with the result that the protection these environmentally-special places theoretically enjoy is in practice constantly chipped away at, and too much development gets pushed into other undesignated rural areas such as the Low Weald.
The system is supposed to constrain the scale of permitted development, not to add to the pressures elsewhere. In practice it fails to work that way. In this instance the fault lies primarily with the Planning Inspectorate who have to approve all local strategic plans.
Politicians mucking about in pig slurry
So where do we end up after all this. We end up, at least in the South East, with a housing policy that demands the delivery of a vastly excessive level of new housing in the most overheated part of the country outside London. This is a policy driven by political, not evidential, imperatives. It ignores the need to focus new development in areas most in need of regeneration and imposes no prioritisation for the types of affordable and social housing for which there is a crying demand, particularly in rural areas of our county. (The affordable housing crisis being a topic to which I will return in a future Mike’s gripe.)
And that, ladies and gentlemen, is what has been begat by years of politicians mucking about in the pig slurry. The good news is that they are still at it so, we wait with bated breath to see whether their latest stirrings of the trough will improve the swill. Lest you think me too cynical, listen to the Government quango, the Infrastructure & Projects Authority which has just reported to its masters that “successful delivery of the Government’s planning reform project appears to be unachievable”. Why is it that politics and common sense are such rare bed fellows?
The table below sets out our estimates of the number of houses and flats that the Government’s “standard method” algorithm requires each Sussex district to build every year (Column 2) and compares that number against the number of dwellings (column 3) that would need to be built within the district to meet its housing need if the improvements discussed in this note were made to the algorithm.
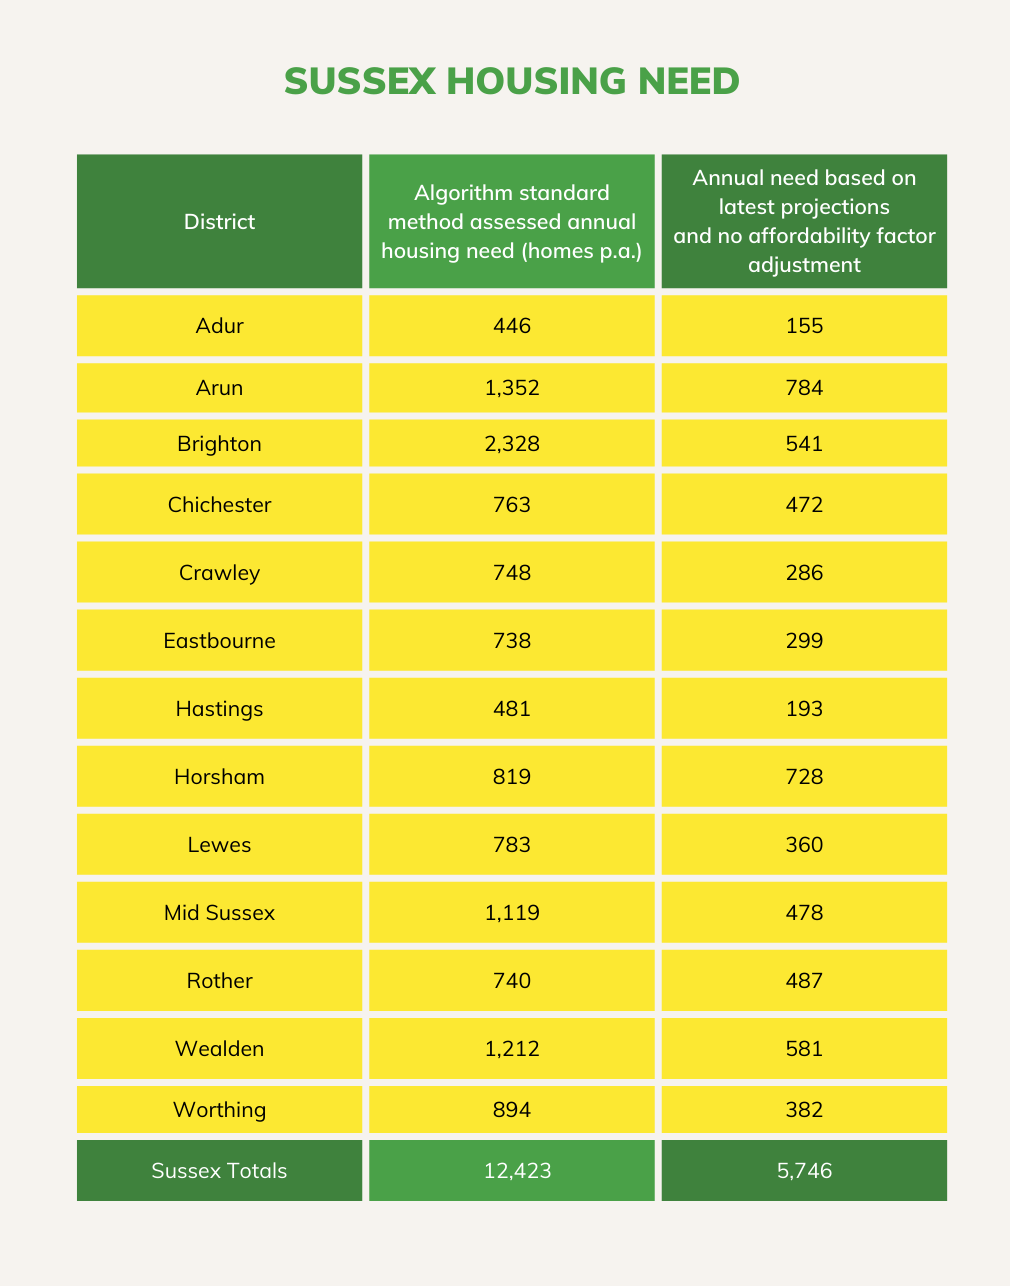
Most Sussex districts have out of date Local Plans. Where that is the case, the figure in column 2 is likely to differ from the housing need figure in the Local Plan where that Local Plan has not been required to apply the standard method algorithm.
Note: This article is not written at the behest of CPRE Sussex. These are the author’s personal views.
Michael Brown